Layers
Figure 48: Layers Tab.
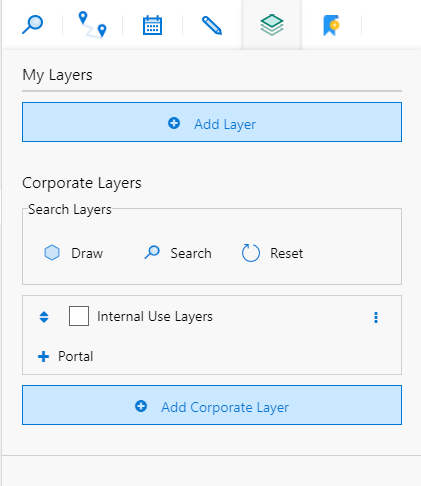
Layers allows users to toggle any personal and corporate layers, on or off.
My Layers
My Layers is a section for adding personal layers.
Add a File
Figure 49: Add File Layer.
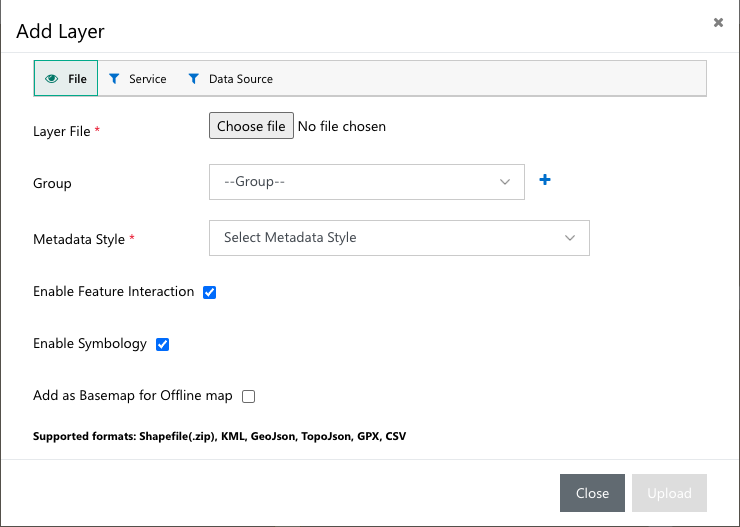
To add a personal layer, click on Add Layer.
| FIELDS | DESCRIPTION |
|---|---|
| Layer file | User can select to upload a layer directly from a file (.zip Shapefile, KML, GeoJSON, TopoJSON, GPX or CSV) or from a service such as ArcGIS |
| Group | By adding a group to a layer, user can bundle other layers into an expandable group to reduce screen real estate usage. |
| Security group | By adding a security group to a layer, user can set permission for the layer to be viewed if the end user is a part of certain team or has a specific role. |
| Metadata style | Metadata style refers to how the attribute data is displayed when clicking on an interactive feature. |
| Enable feature interaction | Feature interaction allows clicking on features to display attribute data (if applicable to the layer) |
| Enable symbology | Enable Symbology respects the symbology given by a layer (if applicable) |
| Add as a Basemap for Offline map | Enable this choice to set up the relationship between configured data sources. E.g., Accounts with Appointments |
Add Service Layer
Figure 50: Add Service Layer.
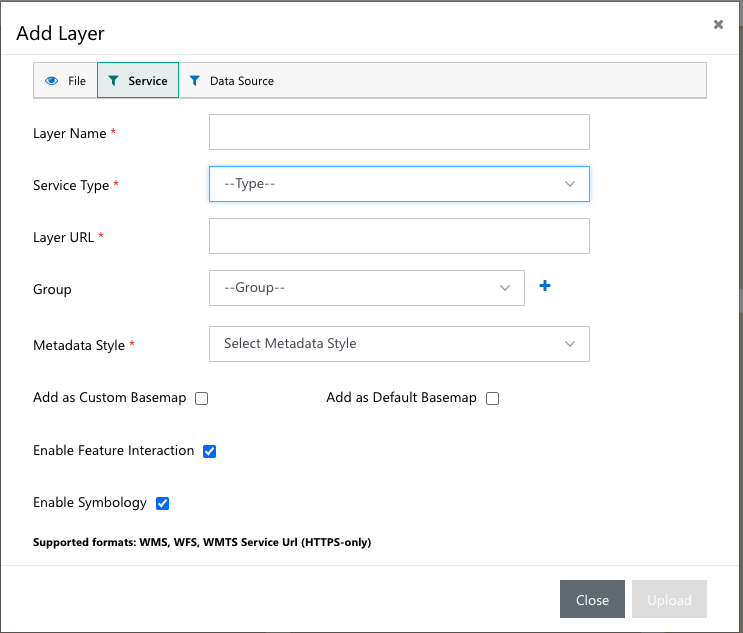
To add a layer from a service (ArcGIS, etc):
| FIELDS | DESCRIPTION |
|---|---|
| Layer name | Layer Name will be the display name for the layer in your layer menu |
| Service type | Service Type is to determine where this layer is coming from |
| Layer URL | Layer URL is the URL to retrieve the Layer from |
| Group | By adding a group to a layer, user can bundle other layers into an expandable group to reduce screen real estate usage. |
| Metadata style | Metadata style refers to how the attribute data is displayed when clicking on an interactive feature. |
| Add as a custom base map | Will allow you to change the Maptaskr base map to load this layer instead (Only available to administrators) |
| Add as a default base map | Will change the Maptaskr Base map to load this layer instead (Only available to administrators) |
| Enable feature interaction | Allows clicking on features to display attribute data (if applicable to the layer) |
| Enable symbology | respects the symbology given by a layer (if applicable) |
| Add as a Basemap for Offline map | Enable this choice to set up the relationship between configured data sources. E.g., Accounts with Appointments |
Add Data Source Layer
User can configure any data source entity as a layer by filling in the form below.
Figure 51: Add Data Source Layer.
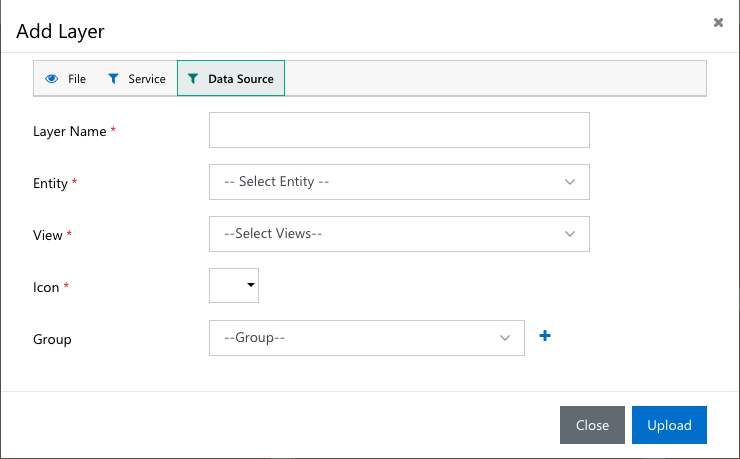
| FIELDS | DESCRIPTION |
|---|---|
| Layer name | Will be the display name for the layer in your layer menu |
| Entity | Will allow to select data source entity |
| View | Will set the view of data source accordingly |
| Icon | Will add custom icon from the icon library |
| Group | By adding a group to a layer, user can bundle other layers into an expandable group to reduce screen real estate usage. |
Corporate Layer
Corporate layers are arranged by the administrator for global access to all licensed Maptaskr users.
Search Layer
Figure 52: Search Corporate Layers.
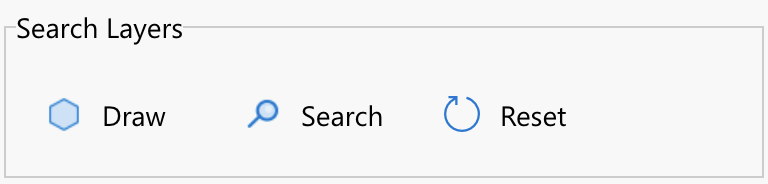
To search a layer in a specific area, click on draw to create a polygon on map in the area user wants to search, it will filter all the layers within the drawn polygon.
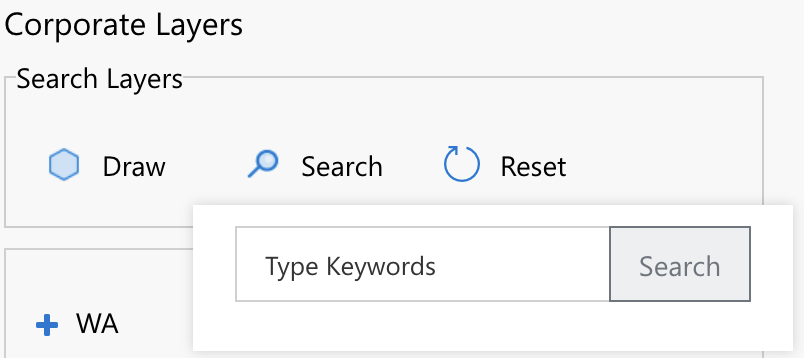
To search a specific layer user can click on search and fill in the keyword in the text box, it will filter all the layers meeting the word criteria.
Figure 53: Search Corporate Layers by Keyword.
User can reset the layers list by clicking on the rest button.
View Corporate Layer
To turn on a layer, select the tick box for the appropriate layer you want to turn on.
Figure 54: Toggle Layer on and off.
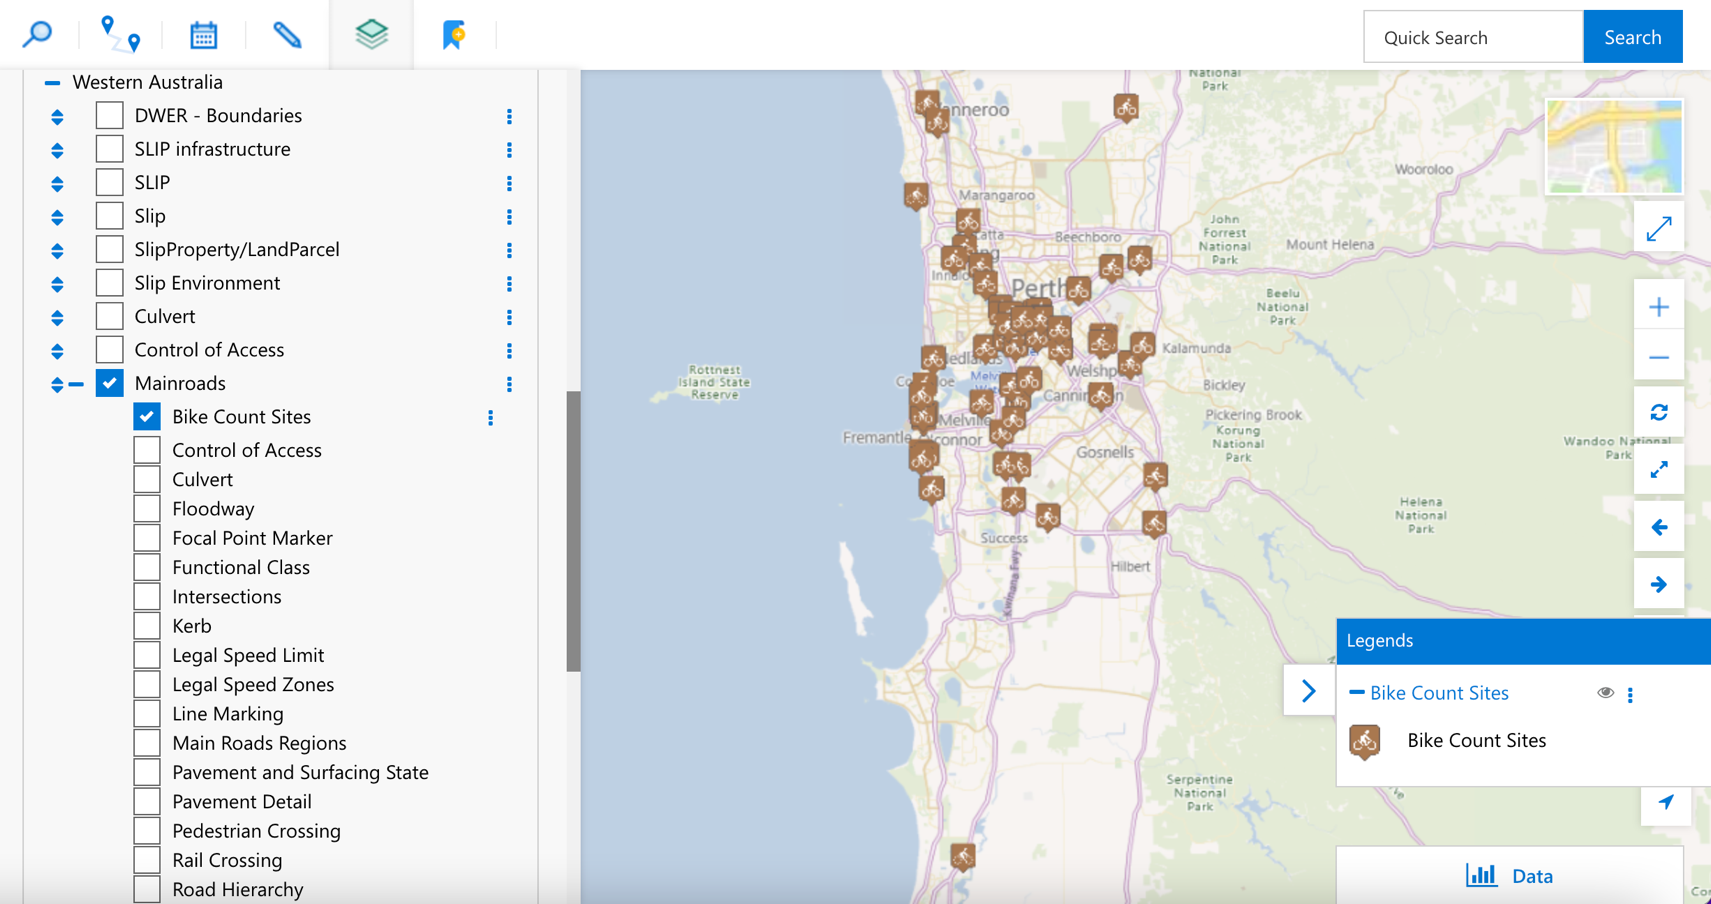
Some layers are added as a large collection of layers as shown above, so selecting the tick box will expand a list of sub-layers. Selecting a sub-layer will load it onto the map.
Clicking on the three-dot icon of the sub-layer will display the following pop-up:
Figure 55: Layer Features.

- Zoom to extent - Allows users to zoom to the extent of this layer.
- Filter by attribute - Allows users to filter through a particular attribute of this layer.
- Attribute table in view - Loads an attribute table containing all attributes for every single feature in the current map view.
- Attribute table - Loads an attribute table containins all attributes for every single feature in the layer.
Figure 56: Attribute Table.
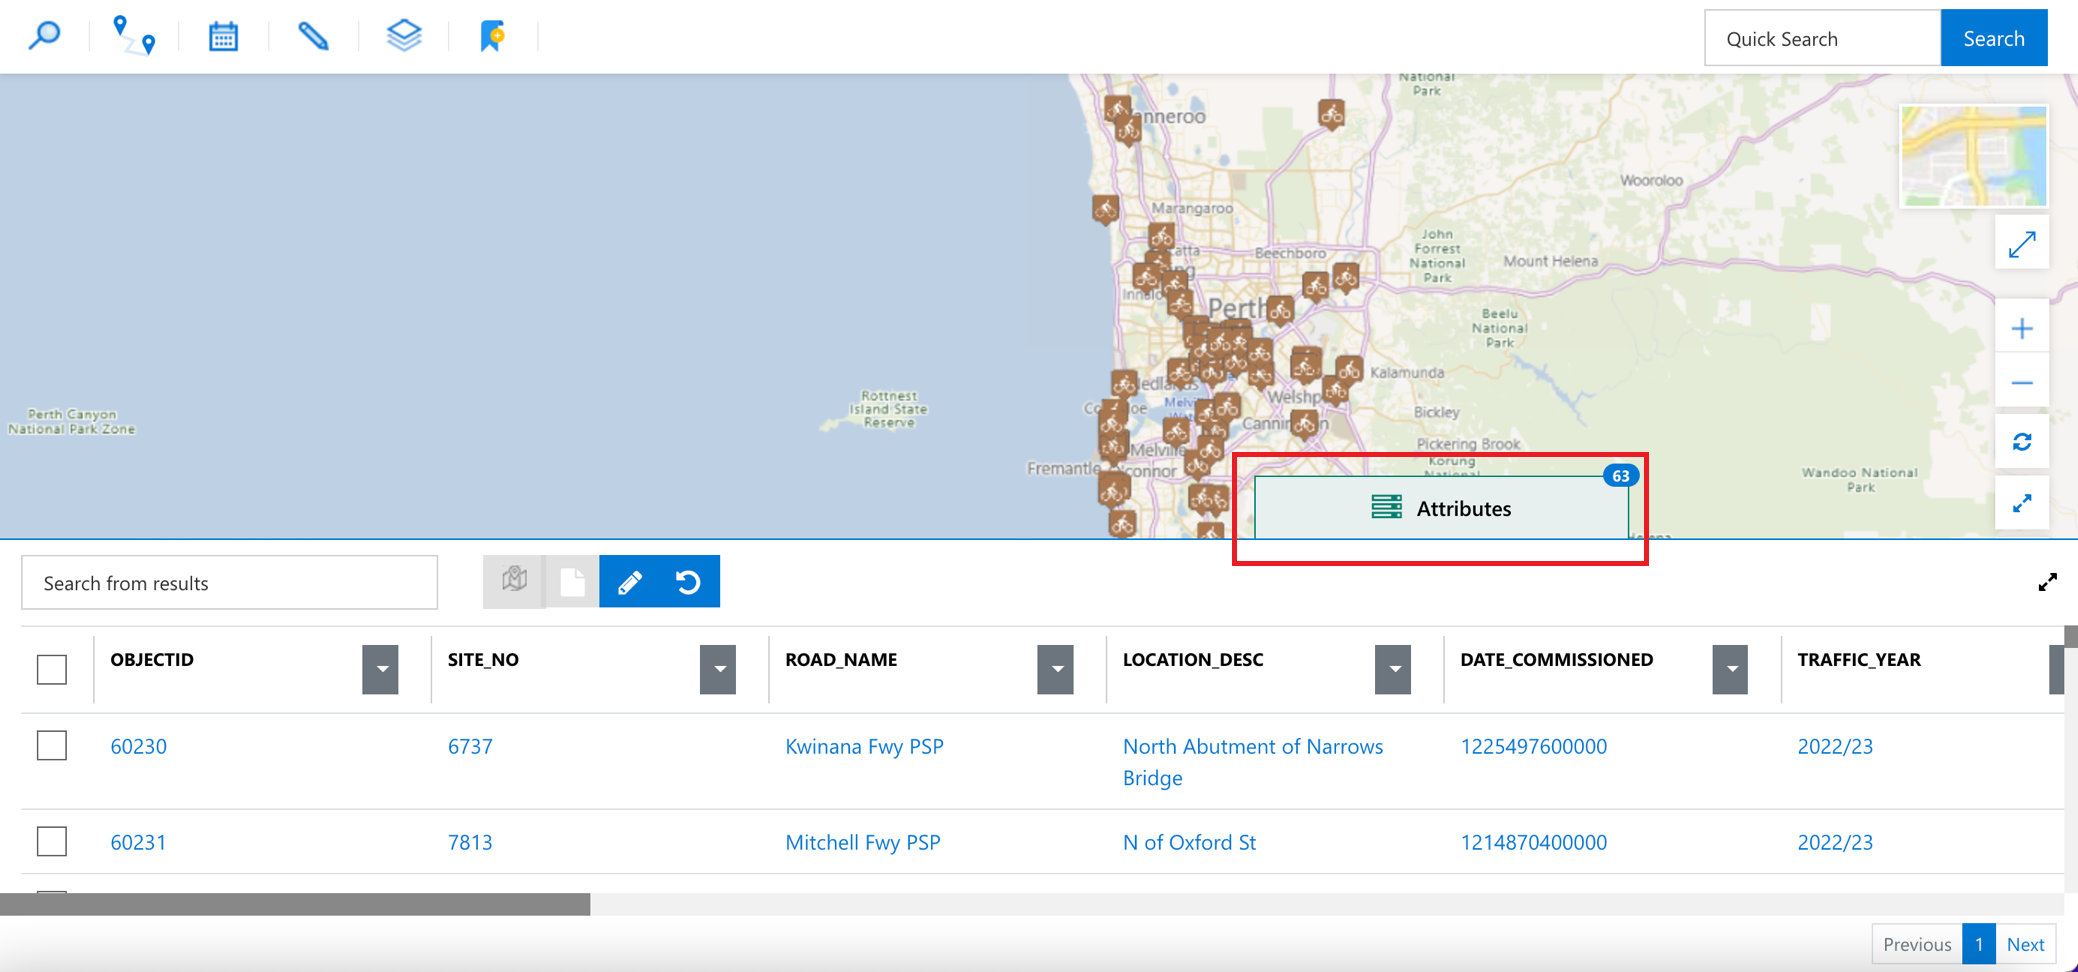
Attribute Table
To load data and display the attribute table, click on the three-dot icon of the sub-layer you want to see and select either of the buttons shown below.

The functionality of the buttons is described as follows:
- Attribute table in view - Loads an attribute table containing all attributes for every single feature in the current map view.
- Attribute table - Loads an attribute table containins all attributes for every single feature in the layer.
Within the attribute table you can perform a number of functions.
- Search attributes by keyword
- Search individual attribute columns by keyword
- Select features on the map using a drawing tool to narrow down the table
- Select attributes using the checkbox to select/highlight features on the map
- Select individual attributes by clicking on the respective row
- Export selected rows to an Excel spreadsheet
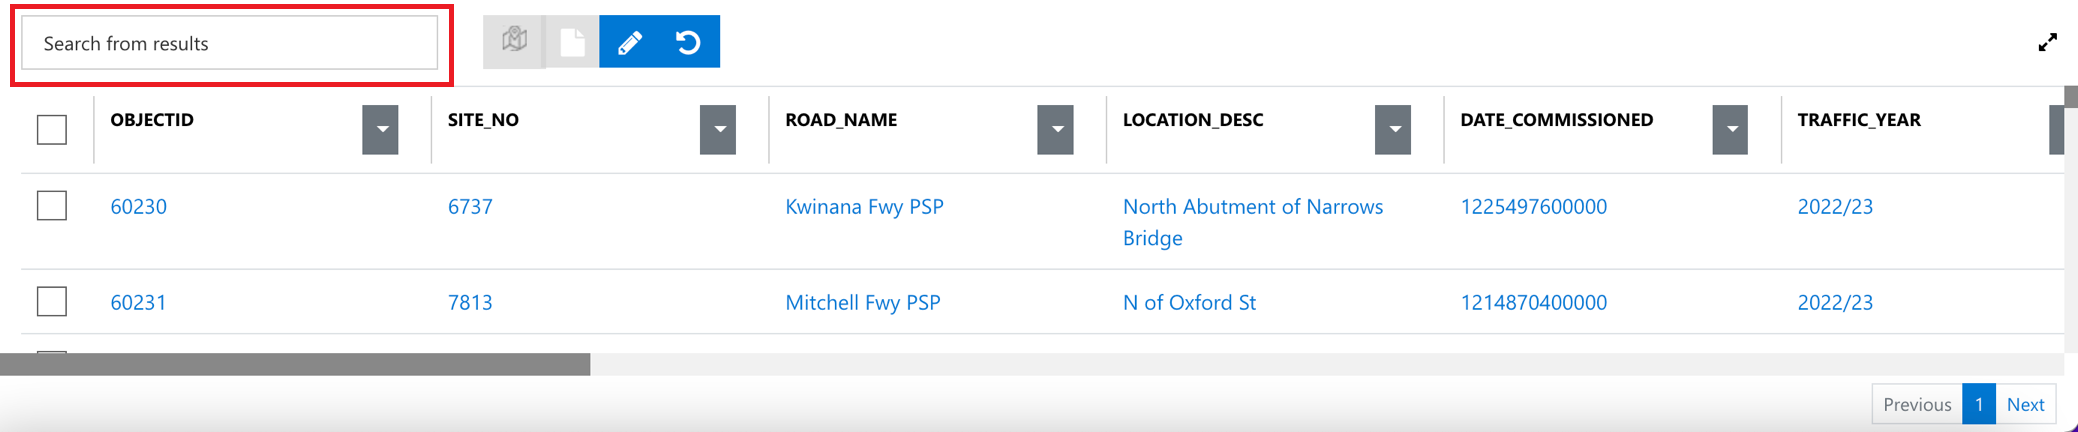
Search Attributes By Keyword
Typing in a keyword in the highlighted search box will perform a filter on every single column available for the layer. The search box is reactive so there is no need to click enter or submit, the filtering will be done on-the-fly.
Figure 57: Search Attributes By Keyword.
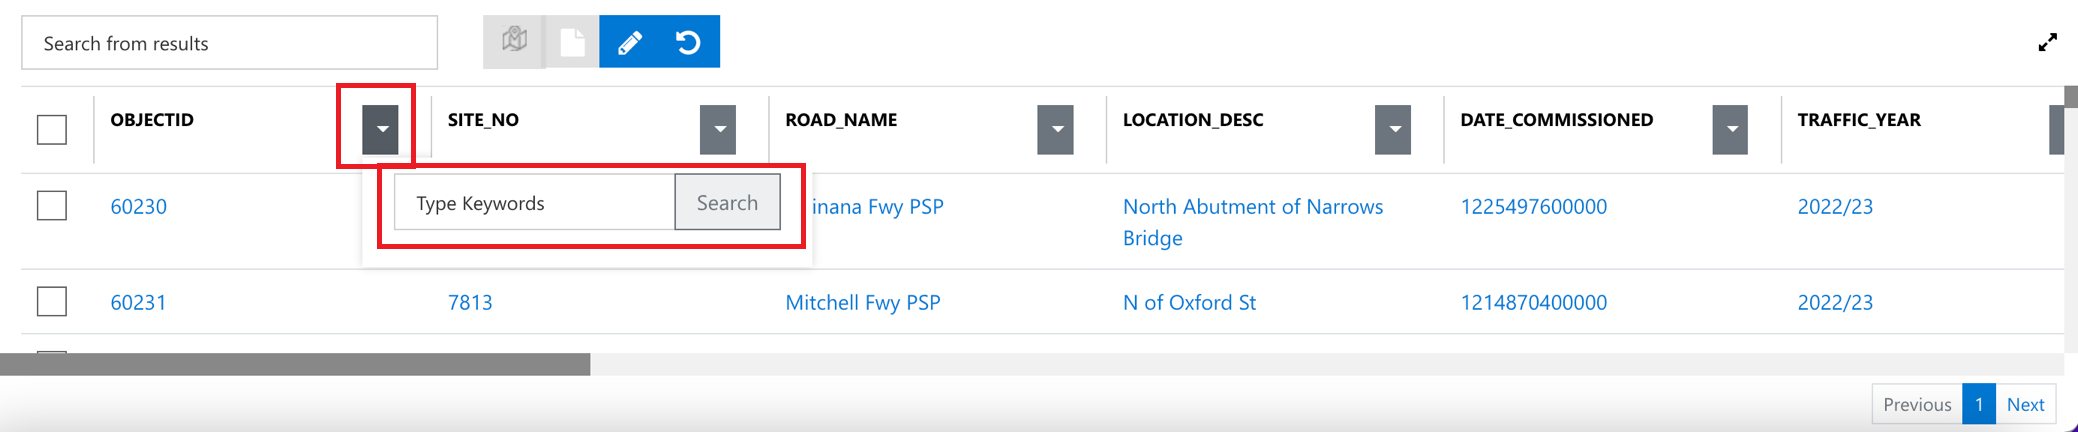
Search Individual Attribute Columns By Keyword
Select the column you wish to filter and click on the dropdown icon to open a search box. This works the same as the search function in Search Attributes by Keyword except the filter will perform ONLY on the column selected.
Figure 58: Search Individual Attribute Columns by Keyword.
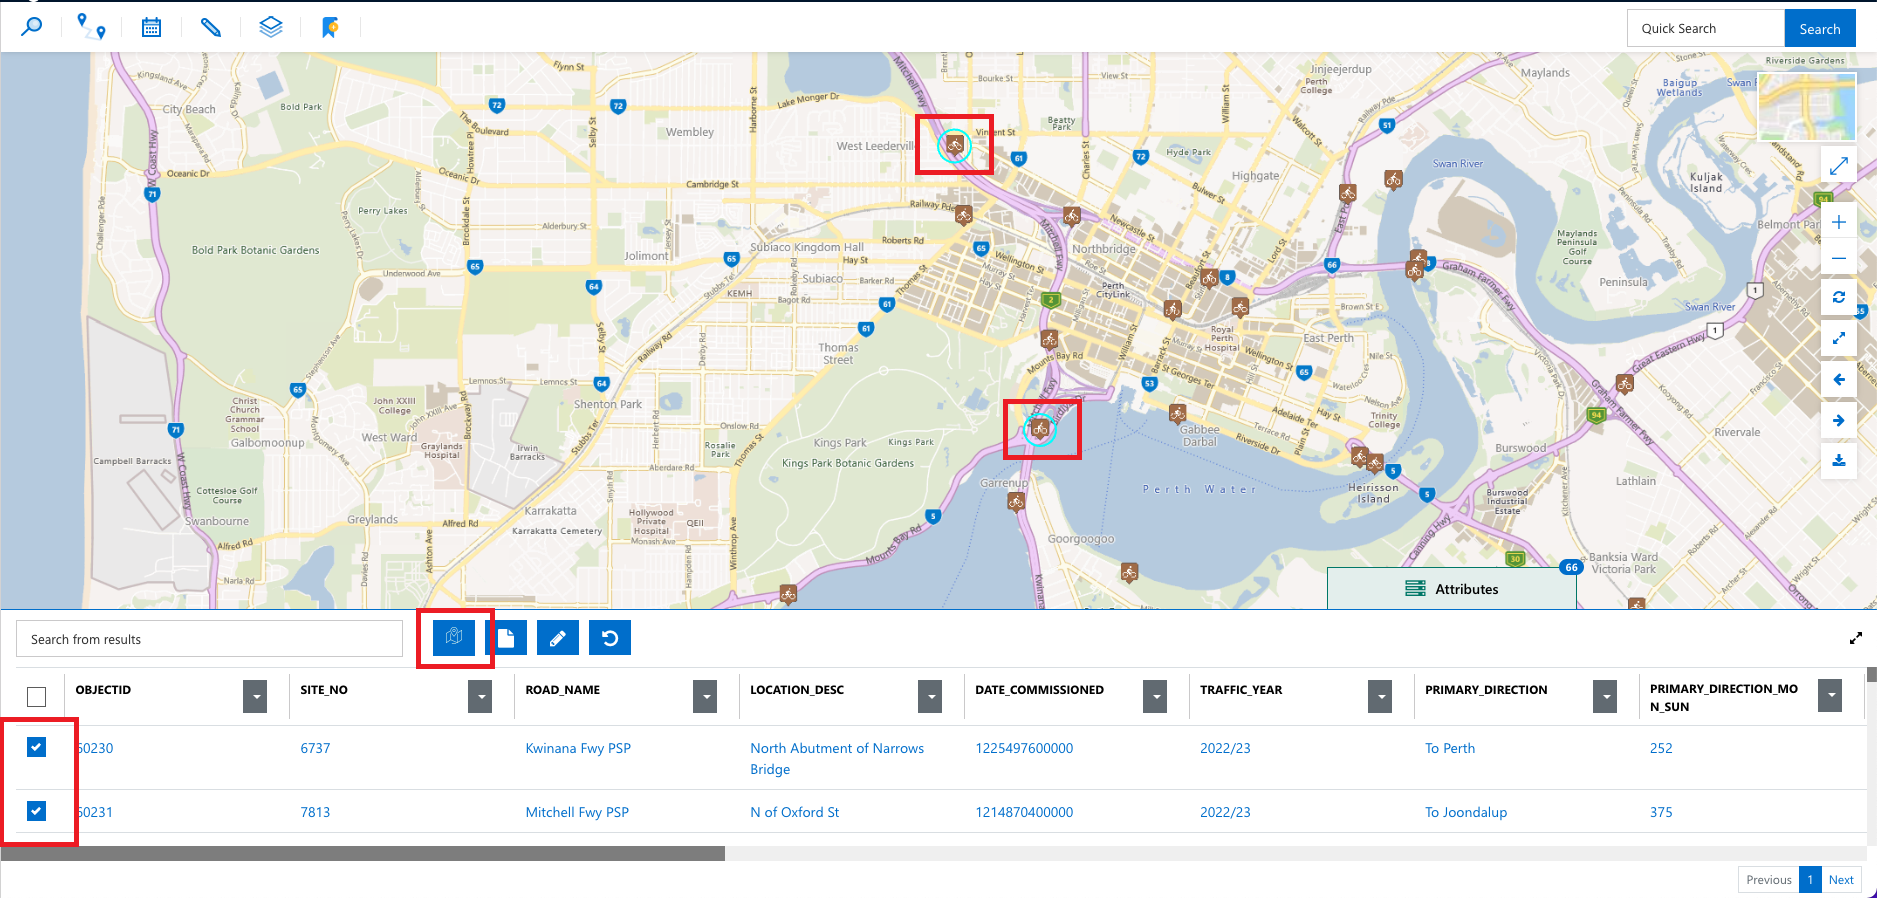
Select Features On The Map Using A Drawing Tool
Select the icon highlighted below to start the drawing tool. Proceed to draw a polygon around the features you wish to select (hold the Shift key to do a free-hand drawing).
Figure 59: Select Features on the Map Using a Drawing Tool to Narrow Down the Table.
Once the polygon has closed, the features within the polygon will be selected and the table will narrow down results.
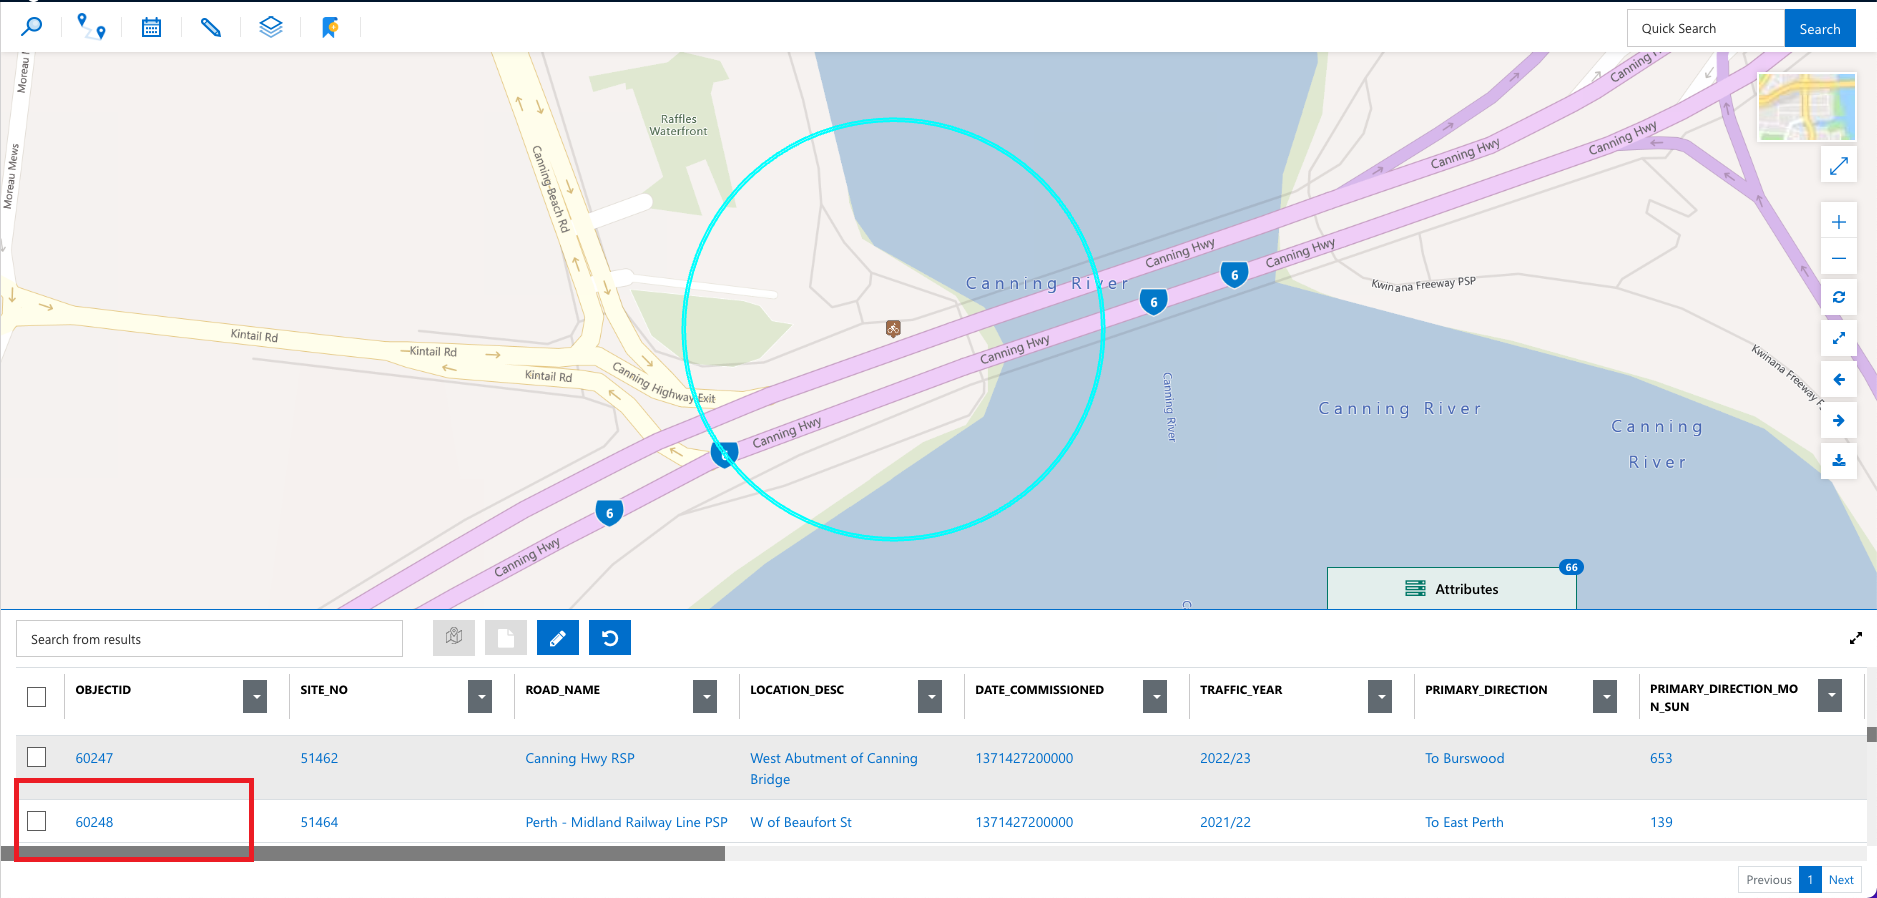
Select Attributes Using The Checkbox
By selecting records and clicking “Plot on Map” button will zoom to the extent of the selected items and highlight the features as shown below:
Figure 60: Select Attributes Using the Checkbox to Narrow Down the Table.
Select Individual Attributes By Clicking On The Respective Row
Rather than using a checkbox, click on any attribute in one row to zoom directly to that feature. It will also select/highlight that feature.
Figure 61: Select Individual Attributes by Clicking on the Respective Row.
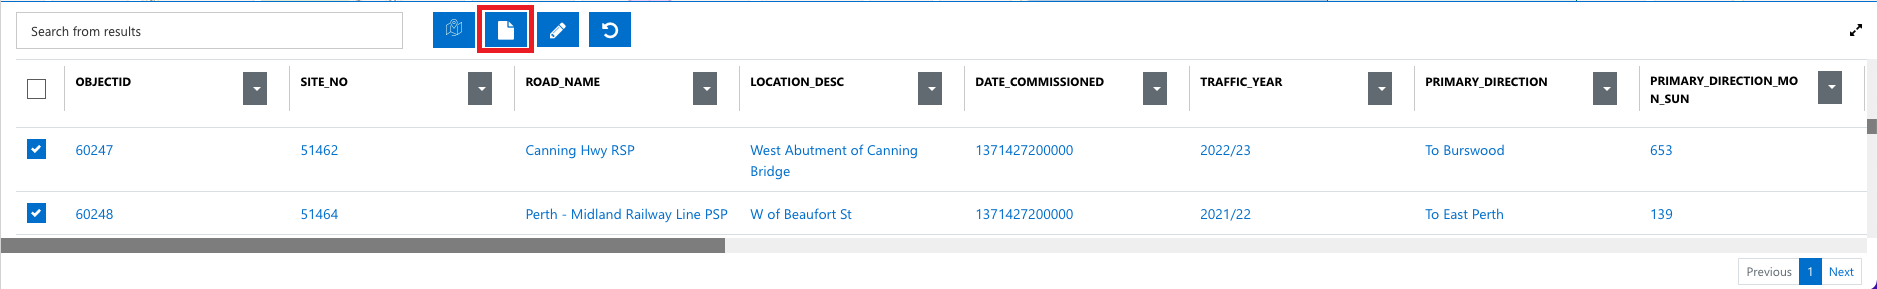
Export Selected Rows To A CSV Spreadsheet
By selecting records and then clicking "Export to Excel" button will download a spreadsheet containing all the attribute data for those selected features.
Figure 62: Export Selected Rows to a CSV Spreadsheet.
Attribute Pop-Up
Figure 63: Attribute Table.